Basic OpenRefine Functions I: Working with columns, sorting, faceting, filtering and clustering
Overview
Teaching: 20 min
Exercises: 40 minQuestions
How do I move, rename or remove columns in OpenRefine?
How do I sort data in OpenRefine?
How can I work with a subset of my full data set in OpenRefine?
How can I easily correct common data issues in my data with OpenRefine?
Objectives
Explain how to reorder, rename and remove columns
Explain how to sort data in columns
Explain what Facets and Filters are
Use facets and filters to work with a subset of data
Basic Operations
- Layout
- Sorting data
- Facets
Layout
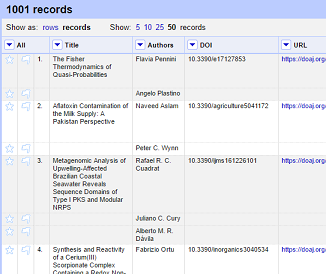
- OpenRefine displays data in a tabular format. Each row will usually represent a ‘record’ in the data, while each column represents a type of information
- OpenRefine only displays a limited number of lines of data at one time. You can adjust the number choosing between 5, 10 (the default), 25 and 50.
- You can reorder or drop columns by using the first column ‘all’ and choosing
Edit columns->Re-order / remove columns … - Drag and drop columns
Another thing you can do is …
Sorting data
- Choose the drop down of the column you want to sort and choose
Sort...`- Once you have sorted the data a new
Sortdrop down menu will be displayed.- Unlike Excel, sorts are temporary, you can remove sort and the data will go back to original unordered state
Sortdrop down menu lets you change the sort (reverse sort), remove sorts and make sorts permanent 4.Sorton multiple columns at same time by added another sorted column
Facets
- A ‘Facet’ groups all the values that appear in a column, and then allow you to filter the data by these values and edit values across many records at the same time.
- A
text facetgroups all string values in a column- Then you can filter the data by these values and edit values across all grouped records
Let’s create a text facet
- Click on the drop down menu at the top of the column and choose
Facet > Text Facet. The facet will then appear in the left hand panel- Filter by facet by clicking or
include- Select multiple values to
include- You can ‘invert’ your selections to
exclude- Include a value and then look at top to invert inclusion.
Exercise 2: Licences used for articles in this file
Use a
text facetfor thelicensecolumn and answer these questions:
- What is the most common Licence in the file?
- How many articles in the file don’t have a licence assigned?
Solution
- Create a facet for the ‘Licence’ column
- What is the most common Licence in the file? Answer:
CC BY- How many articles in the file don’t have a licence assigned? Answer: 6
Filters
- You can also use
text filtersto filter data - Text filter look for a specific strings
- when you have filtered the data displayed in OpenRefine, any operations you carry out will apply only to the rows that match the filter
- Applied by using drop down on top of column and choosing
Text Filter - Type the word you want to filter on and OF will display only rows that contain that word
- Use can use regular expressions or GREL in the filter.
- Operations you perform on the data during a filter will only apply to the rows in the filter.
More on Facets
As well as ‘Text facets’ Refine also supports a range of other types of facet. These include:
Numeric and Timeline facets display graphs instead of lists of values. The graph includes ‘drag and drop’ controls you can use to set a start and end range to filter the data displayed.
Scatterplot facets are less commonly used - for further information on these see the tutorial at http://enipedia.tudelft.nl/wiki/OpenRefine_Tutorial#Exploring_the_data_with_scatter_plots
Custom facets are a range of different types of facets, and also allow you write your own custom facets. Some of the default custom facets are:
- Word facet - this breaks down text into words and counts the number of records each word appears in
- Duplicates facet - this results in a binary facet of ‘true’ or ‘false’. Rows appear in the ‘true’ facet if the value in the selected column is an exact match for a value in the same column in another row
- Text length facet - creates a numeric facet based on the length (number of characters) of the text in each row for the selected column. This can be useful for spotting incorrect or unusual data in a field where specific lengths are expected (e.g. if the values are expected to be years, any row with a text length more than 4 for that column is likely to be incorrect)
-
Facet by blank - a binary facet of ‘true’ or ‘false’. Rows appear in the ‘true’ facet if they have no data present in that column. This is useful when looking for rows missing key data.
- more on facets: https://github.com/data-lessons/library-openrefine/blob/gh-pages/_episodes/03-basic-functions-I.md#more-on-facets
- if there are too many unique facets OF will cough and it won’t create the facet (like faceting on word on title)
Exercise 3: Find all publications without a DOI
- Use the
Facet by blankfunction to find all publications in this data set without a DOISolution
- On the
DOIcolumn drop down and selectCustomized facets > Facets by blankTruemeans that it is blank, so you can:
- Select
includefor true to winnow down the publications
Changing Data through Facets
- You can change the values for faceted data
- Mouse over facet and click
edit
??? This approach is useful in relatively small facets where you might have small variations through punctuation or typing errors etc. For example, a column that should contain only terms from a small restricted list such as days of the week or months of the year.
Exercise 4: Correct the Language values via a facet
Text faceton thelanguagecolumn and correct the variation in theENandEnglishvalues.Solution
- Create a Text facet on the Language column
- Notice that there is both
ENandEnglish- Put the mouse over the
Englishvalue- Click
Edit- Type
ENand clickApply- See how the Language facet updates
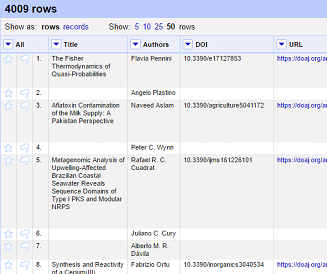
Rows and Records
- OF has two modes of viewing data:
RowsandRecords - We’ve been using rows so far: each row representing a single case or record in a dataset (an article in our case)
- In Records mode, OpenRefine can link together multiple rows as belonging to the same Record.
- How this works can be seen in Exercise 5…
Exercise 5: Split author names into separate cells
If you look at the Author column you should be able to see that there are multiple names in each cell separated by the pipe or vertical bar symbol
|. To work with the author names effectively we need to split them into separate cells:Use the
Edit cells > Split multi-valued cellsdrop down option on theAuthorscolumn to separate the authors by the|separator. Switch betweenrowsandrecords. What do you notice?Solution
- Click the dropdown menu at the top of the Author column
- Choose
Edit cells->Split multi-valued cells- In the prompt type the
|symbol and click ‘OK’
- Note that the rows are still numbered sequentially
- Click the ‘Records’ option to change to Records mode
- Note how the numbering has changed - indicating that several rows are related to the same record
Clustering
- Groups together values in a column that are ‘similar’ and enables you to merge together several different, but similar, values into a single value
- This is very effective where you have data where there can be minor variations in data values that are likely such as names of people, organisations and places.
- To use the
Clusterfunction, click on theEdit Cellsmenu option in the relevant column and choose ‘Cluster and edit…’ - Clusters are created using an algorithm & OF has multiple clustering algorithms – experiment to see what does best
- For more information on the methods used to create Clusters see https://github.com/OpenRefine/OpenRefine/wiki/Clustering-In-Depth
- Post cluster you have option to merge the values together - replace with a single consistent value.
- OF will choose the most common value, but you can change to another value
- You can also type a new value
- The Clustering function can also be accessed via the drop down menu at the top of a column by selecting
Edit cells->Cluster and edit …
Exercise 6: Use Clustering to clean up author data
- Cluster on the Author column using:
Edit cells->Cluster and edit …- Choose
Edit cells->Cluster and editfrom the author column (which should be split into individual values from the last exercise)- Using the ‘key collision’ method with the ‘fingerprint’ Keying Function work through the clusters of values, merging them to a single value where appropriate
- Try changing the clustering method being used - which ones work well?
Break
Key Points
You can reorder, rename and remove columns in OpenRefine
You can use facets and filters to explore your data
You can use facets and filters work with a subset of data in OpenRefine
You can easily correct common data issues using Facets and Clustering